| A glimpse | |
of harmony |
A new picture of harmony based on the experience of consonance
Introduction
This page describes a deliberate attempt to represent harmony as a physical reality. All of the effects shown are well-known to musicians and have been for centuries. The novelty of my approach resides in the fact that I dwell on considerations which are generally acknowledged in all the documents I have read on the subject of harmony theory but which are developed by none. Even the most advanced books say that scale is rooted in harmonics and go on to assert that equal temper is "close enough". They leave it at that, usually no later than the first introductory remarks. I will not say that classical theory is junk. It is the distilled essence of traditions which have unfailingly served generations of musicians. Classical theory is of immense value as the sincere testimony of generous people whose first wish is to make things easier for us. I will describe a few classical models as succinctly as possible. I assume that you have a general idea of the role played by harmonics in tonal music but I will also sketch in a few of the basics.
This study goes beyond casually accepting that harmonics have some role to play in tonal music. I use Fourier synthesis as the central tool for examining consonance. Why this has never been done (?) escapes me. To be fair, I rely on the computer, a device which hasn't been available for very long. Meager passing knowledge of music theory, physical science, and computer programming may just happen to give me a chance opportunity to outline a new approach.
I will begin with the picture which is the singular result of this study. I will then develop the ideas behind it. In passing, I will point out a few things which might be learned from it. This English translation may deviate considerably from the original French account. The original is mainly a compilation of raw data which could be of some value if this work turns out to be of some use to someone. When I translate my own stuff, I invariably end up with a re-write. I am an undisciplined brat. This new version is more explicit when it comes to meaning and interpretation.
The picture
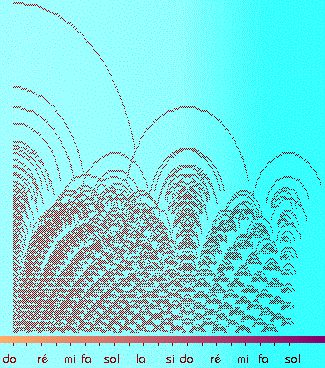
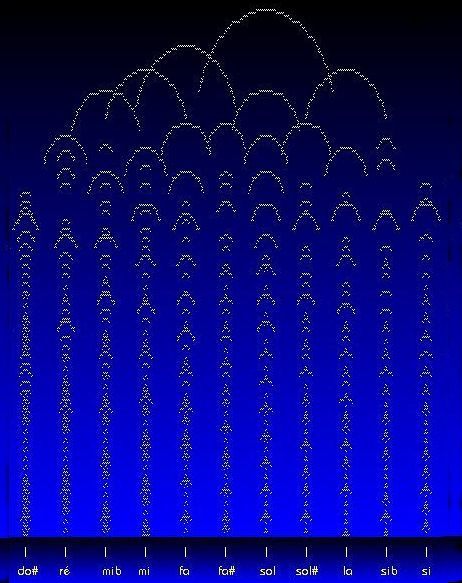
The following image gives a visual rendering of the effect produced by two different tones played simultaneously by similar instruments such as two recorders or two guitar strings.
 |
The lower of the two tones is constant (in this model) and arbitrarily assigned the name "do", that is, "c". This is the "reference tone".
The other tone "slides" up through two octaves starting from the reference, from left to right. The consonance produced by the different "c's" is displayed as a vertical stack of "harmonic responses". The character of the response is different for the "unison" (identical sounds) and for the octaves. The same is true of all other intervals This characterises the sound of pipes and strings. If this characteristic is present, then we are dealing with tones. The event which is designated in "classical" harmony as a "perfect consonance" appears here as an arc of very large radius "hovering" over the corresponding stack. |
Perhaps the most striking feature of this is that the strongest consonances are surrounded by regions where nothing at all is happening. This happens everywhere to some degree and it is especially visible near low harmonics: fundamental (1), octave (2) and twelfth (3) [The third harmonic is an octave above the fifth. 5+8=12. I will call it a fifth from now on but it is a misnomer!]. This seems to explain why some extended and altered chords don't really disrupt the main harmony. Dominant and major sevens, nines and flatted nines, all are buried deep in the well surrounding the second harmonic. The same is true of diminished and augmented fifths around the third harmonic.
The picture was drawn with an antique msdos computer with no graphics capabilities which I happened to be using when I did this. It is "ascii art" text. I shrank it so it looks almost like a "real" picture. I am nevertheless satisfied with the result. The very fact that purely theoretical considerations produce a readable drawing is significant. OK. I could do better. The "success" of primitive graphics might indicate a certain robustness of the model. It is more important to hear nature speak artlessly than to develop treasures of cunning to make it "look good".
 |
vertical harmonic stepsWhen you scan a portion of the drawing from top to bottom, the harmonics of the reference tone which produce a consonance with the moving tone generate a pattern. The harmonic indices (1, 2, 3...) move in discrete steps starting with "1". They are integers. The succession of integer harmonics which constitute the tone is a natural characteristic of the vibrating string or pipe. More the point, it is a natural response over which we have no control whatsoever. |
 |
horizontal scale continuumFrom left to right, the variable tone moves continuously to a higher pitch. In other words there is a ininite number of tones to be heard, let us say, between "d" ("ré") and "e" ("mi"). In other words, the scale degree can be a real number: taking c [do] as zero, the degree 4.8989 on the tempered scale is somewhere between e [mi] (degree 4) and f [fa] (degree 5). The succession of tones in a scale is arbitrary and we can choose it freely - within limits. All scale "notes" coincide with "hot spots". The consonant hot spots are exactly defined as zero-beat (see below) but moving slightly to one side or the other produces a slow "beat frequency" which is almost undetectable in any but the slowest movements and enjoyable in many ways. It is physically comparable to a rotary (Leslie) speaker or an electronc phasing effect. The slight offset changes how the vertical pattern is expressed: it sounds "busier". |
The pictures made with these definitions are reproduced here without any "doctoring" or enhancement (other than a bit of color just for kicks).
The Corti organ in the inner ear which detects sounds is a physical frequency analyzer because of its spiral shape. Therefore, at least part of the information sent to the brain has already undergone some Fourier analysis. The organ is "optimized" for the separation of lower frequencies. [source: "La grande Encyclopédie Larousse"]
Nerve cells in the Corti "detector" recover fast enough to send data in the range 20-2000Hz directly to the brain as vibrations (as if through a microphone wire), presumably to be analyzed by brain "software". [source: "La grande Encyclopédie Larousse"]
Here is a reasonable hypothesis: consonance will occur exclusively in cases where harmonic frequencies are close enough for the ear/brain apparatus to fail to separate them.
This is subjective but I feel that, in the register of the guitar, notes separated by more than a quarter-tone are discernable and the fundamental harmonics do not mix together to produce a single sound. By definition, they are not consonant.
Guitar players are familiar with the "beating" of sounds which are nearly identical. When the guitar is slightly out of tune, tones which should be the same make a sound together like "wahwahwahwah" instead of the expected "waaaaaaaahhhh". Tuning the guitar is the act of removing all the beats. Zero beats is called a perfect consonance. Slow beats made by nearly same tones are still pleasant, let us say, up to 5 cps. It is a matter of taste to some extent but faster beats may still have some musical qualities. A warble in the vicinity of 20 cps or higher could be perceived as unpleasant. Higher beat frequencies could of course be confused with bass tones but they are probably not heard (see previous paragraph). They may be percieved subliminally. The experience of consonance isn't limited to perfect zero-beat phenomena. Also, consonance is just one aspect of the sound of a chord. In the grand scheme of things a lousy consonance with a high beat frequency may be part of a chord sound which is agreable in other ways.
The program uses a "brute force" method to search for consonant encounters. Spectra are synthesized for each tone pair and compared. Harmonics which "beat" no faster than 30 cps are tabulated as "consonant encounters".
The "beats" vary with absolute frequency and are not proportional to tonal distance. A quarter-tone in the mid-register of the guitar beats at about 30 cps, more in the high register and less in the low. This parameter could obviously be refined. It is now a roughly applied rough guess.
These pictures represent consonance as a spontaneous phenomenon produced by vibrating strings. There are obvious "hot spots" such as the octave c-c [do-do] or the fifth c-g [do-sol]. Instrument makers take these hot spots on board and define certain tones very strictly. The succession of hot spots is obviously very regular but it is not trivial. It does not boil down to a simple formula. The regularity of consonance has always been a matter of fleeting insight and has caused a great deal of writing for centuries. The phenomenon is shown here as the complex monster it really is.
As I said in the introduction, the purpose of this study is the visualisation of musical perception. The perception is generally well known and documented. The first goal is to improve our understanding, not to disprove existing music theory. I am motivated by my addiction to clarification.
 |
The consonant "neighborhood" of the low e [mi] is obviously different from the high one. The low interval is the classical "major third". The high interval is the "major tenth" (or decime). The "musical" ear can distinguish between these different kinds of consonance about as easily as the eye can tell red from blue. |
Musicians have probably known this for sure since whenever. Some classical theories can be misleading in this instance. To confine the discussion of intervals principally to the octave, and to treat extended intervals whenever possible as a generalization, is clearly wrong. I should take this opportunity to be reminded that jazz theory has vigorously changed the popular view that "octaves don't matter". A jazz melodic or harmonic scale may include an e in one octave and an eb in the one above. It doesn't matter what you call it. [You might think of it as a C7/#9 chord or something else, depending on the key, making eb into a d#. This is just a notation issue which you don't think about when playing so it doesn't matter what you call it.] It sounds perfectly natural when you do it. Let us be reminded, also, that we are now accustomed to chord names spanning several octaves such as C9, C11, C13, etc. After trying to make do with a chord vocabulary that stops at C7, the "new" chords are a godsend. They aren't really new, perhaps. For a self-taught dunce like me, jazz theory is more useful than all that came before.
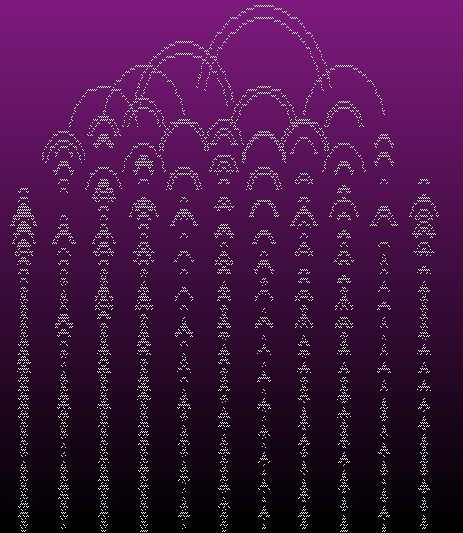
Scale consonances over the interval c#-b [do#-si]
 |
One can highlight just the "best" consonances. This constrained version of the picture gives a fair account of the "classical" vision of consonance. This focuses on the relationships among small harmonic indices for tones confined to a single octave. It is analogous to a hit-parade. Is the top of the pops representative of what is happening today? I don't know. |
 |
As one develops the harmonic series below each main consonance for each tone of the scale, one sees that each one acquires a particular (recognizable?) texture in the vertical depth.
It appears quite clearly that consonance isn't just the happy matching of a few harmonics of small degree but a spectrum of succeeding matches. The musician who is playing on consonance feels intuitively that he is not hearing two tones but the particular timbre of the combination. Polyphonic music produces timbres which are inaccessible to monophonic music where the timbre is mainly a characteristic of the instrument itself. [This is an over-simplification but it is more or less true. The player adds his own bit to the timbre but nothing quite as dramatic as what appears here.] This drawing gives some idea of the sound of the guitar harmonizing with itself with two voices. |
 |
This picture superimposes two versions of the preceeding one. One version is equal-tempered and the second is based only on harmonic ratios. The second hits hot spots more squarely.
In this model, one can see that the consonant landscapes are very similar. This could be an indication of the ability to harmonize and one might tentatively conclude that equal temper isn't as bad as they say. This drawing gives some idea of the sound of two voices of equal temper (a guitar, maybe) together with a third of natural temper (perhaps a violin). I am convinced that this would never happen exactly in reality beacuse the violinist could improve the focus: he might be attracted to the guitar pattern and generate "perfect harmony", newly defined as something more like the preceeding picture. |
Existing theories
I will not say that classical theory is wrong. At the time and in the place it is written, it is always perfectly adequate for its purpose. I would suggest that its representations are lacking. Poor representations diminish persuasive force, it nothing else.
Classical theory mostly adopts the attitude whereby the universe of harmony is so rich, varied, and large that you are always better off listening to what is played before attempting to understand the rules which the musicians claim to follow. Modesty is a widely recognized intrisic characteristic of any musical theory. It is customary, when exposing a particular set of rules, to mention in passing that other styles (most notably, "ethnic") don't follow the same rules at all. Harmony is often included in this caveat emptor. One purpose of this study is to suggest that conventional harmonic landmarks may all be a bit more universal than one dared to imagine a few short years ago. Here are a few tidbits of classical theory.
The harmonic "hot spots" were intensely scrutinized during the Renaissance. Early theories were invariably dominated by "geometric" or "arithmetic" considerations. Such is the origin of the so-called natural scale.
 |
The importance of ratios of small integers in determining intervals was empirically discovered very early on. This rational scale follows most of the "hot spots" in my drawing quite precisely. |
 |
When one calculates the relative ratios between succeeding intervals, a sort of coherence emerges: there are only 3 kinds of step from neighbor to neighbor. |
 |
Another remarkable property of the natural scale ist that it includes 2 identical long intervals which are exactly equal in length but of different composition. |
As mathematical models go, this one is fairly simple. It is nevertheless more complicated than most musicians would like. It is much easier for us to think about what we are doing if we use just one kind of step (instead of "only three"). This new scale is said to have equal temper.
I call this new scale the "guitar-maker's scale". Indeed, it is one of my favorite conjectures that it originated with fretted instruments. If you take the string length and divide it by a certain number (the twelfth root of two, that is, 2^(1/12)), you get the position of the first fret on the neck. Divide the new string length by the same number and you place the second fret. Carry on in this manner and you wind up with the 12th fret in the exact middle of the guitar. This is the way modern guitars are built. I don't know how old the method is but it doesn't require any special knowledge beyond the reach of a medieval builder.
The equal-tempered scale is close enough to the main hot spots to produce some agreable consonances. It also solves a problem with the natural scale which is that transposition is impossible because of the irregularities: when you play in certain keys with the natural scale, certain common consonances become ugly, that is, they exhibit very high beat frequencies.
The equal-tempered scale is always a bit out but it never goes "sour" like the natural scale sometimes does. [These low-resolution pictures don't show this very well, one would have to look at the raw data which are unequivocal.]
[Kyle Gann suggests that equal temper sounds more exciting and natural temper more soothing. Westerners in the late XXth century were often looking for excitement in music, hence the widespread tendancy to adopt equal temper during this period.]
The application of harmonics to the understanding of scales and chords is not new. The idea that the sensation of tone and timbre depends only on how harmonics line up in the spectrum of a sound was put forward by Hermann Helmholtz in the XIXth century and hasn't been seriously challenged since that time. Here are a few common representations.
 |
The wave shows amplitude on the vertical axis and time horizontally. The movement is said to be periodic because it repeats forever. This obvious periodicity is recognized and the ear immediately concludes that it is hearing a tone. The wave shape determines the timbre. The sawtooth waveform is the one I use in my model because it is very easy to synthesize using a formula. |
 |
In chord playing, two similarly-shaped waves are heard together. The new green wave has a higher pitch. It is a major third above the original blue one. The blue one oscillates four times while the green one oscillates 5 times. |
 |
The ear hears the combination. The combination is still periodic but the period is much longer than the original component periods. The ear doesn't decypher the combined period because the wave shape is highly irregular. The ear doesn't hear a tone. |
 |
The sawtooth (or any other wave shape) can be represented as the sum of an infinite number of sine waves called "harmonics". This representation is called "Fourier synthesis", after the XIXth century inventor of the method. The sawtooth shown in the previous drawings is an approximation calculated using the first 1000 terms of the infinite Fourier series.
The sum of sine waves is graphically confusing and it is more convenient to view the spectrum. |
 |
Each vertical spectrum line represents the amplitude of a harmonic. The horizontal axis represents frequency. The profile formed by the succession of lines is a new, highly readable, view of timbre. The regular pattern of harmonics is a characteristic of tone.
The spectrum of c (sawtooth). |
 |
The spectrum of e (sawtooth). |
 |
The sum c and e. The tones happen to have some shared harmonic frequencies (shown in red). There is a new pattern due to consonance, that is, harmonic coincidence. |
Let us not forget that chords don't enter the ear with consonant frequencies highlighted in red! The pattern is detectable but it isn't as obvious as the tone. It doesn't hit you like a ton of bricks.
These old representations are good because they include all the data being fed to the ear. My new picture for consonance only includes near (consonant) harmonics and ignores the rest. On the other hand, the crude spectrum isn't very good at showing consonance because it doesn't highlight close frequencies, only identical frequencies. In fact, the majority of real consonances is merely close - so the raw spectrum actually reveals nothing. It is good for showing how the timbres are broken when combined. The broken timbre is an important part of the sensation of chord, alongside consonance.
Today's dj software includes visual displays which bounce along with the sound.
 |
A spectrum from windows media player. The white foam represents recent maxima. |
 |
A texture from windows media player. The oblique line which dominates the picture doesn't represent anything in the sound. It is an artefact arbitrarily introduced by the programer. |
These effects are sophisticated but they don't reveal any particular property of the music. Their purpose is to decorate, not to inform. They do encourage one to believe that there can be meaningful visual representations of sounds.
Conclusion
I spent several years idly wondering why nobody ever did a study like this. Now I know.
The first purpose of such an investigation is, of course, to understand some of the real issues which underlie the choice of scale. One important thing which isn't dealt with at all here is the freedom enjoyed by singers, violins, woodwinds and, to some degree, guitars, to bend the scale at will. I assume (it is not proven here) that any "bendable" tone source may choose to hit hot spots exactly or to hit them on the edge so as to get a musically interesting beat frequency. It should be immediately obvious that this is true regardless of the ambient scale in any given orchestra: even if the equal-tempered scale prevails, a vocalist can nevertheless hit any hot spot exactly. It takes only two to harmonize.
To sum up, here are some pivotal ideas.
Consonance cannot be ignored.
If you think you have a good reason to enjoy wading through dull numerical tables, the following page may provide more information : "The direct examination of consonance".